Denoising trajectories are context for what comes next.
Trajectory Forcing turns intermediate denoising predictions into useful context for generating subsequent video chunks, across supervised training and self-rollout training.
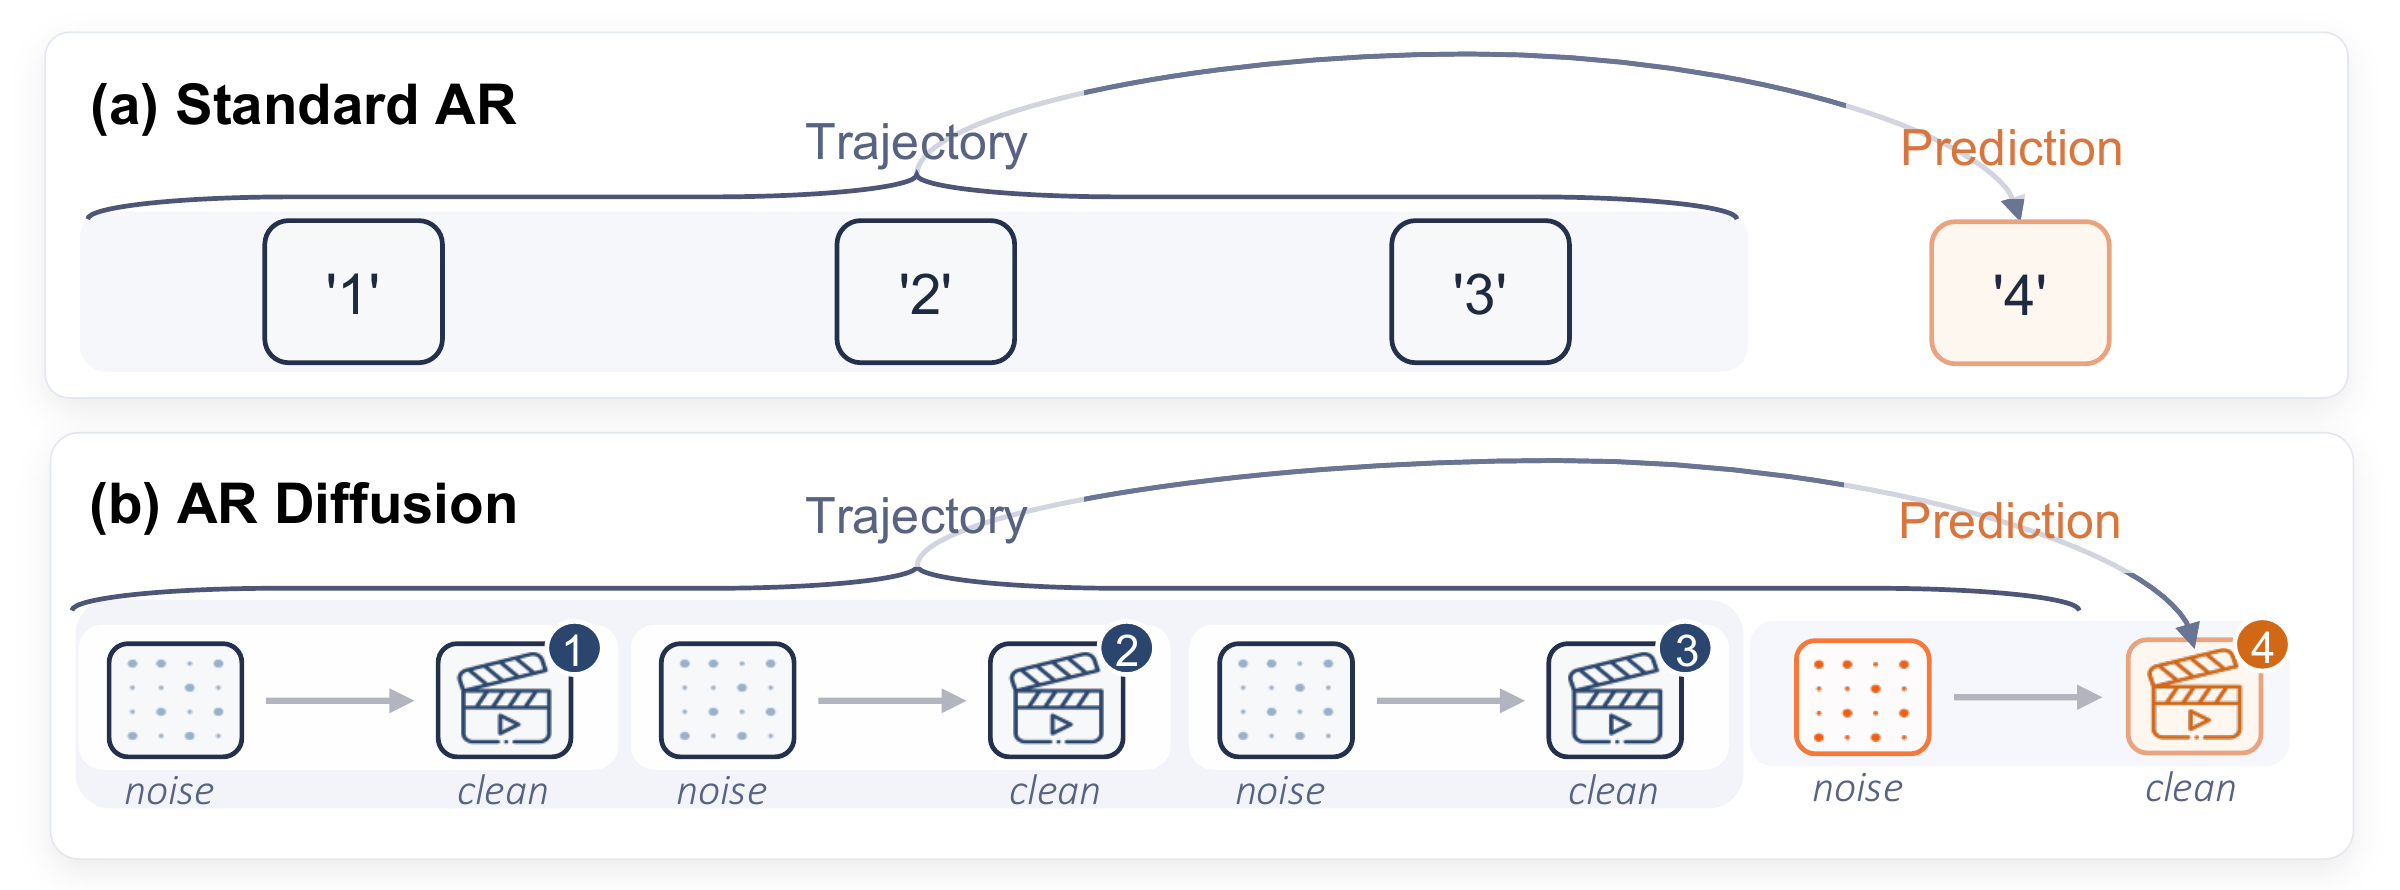
(a) Tokens are generated as single units. (b) Video chunks leave a history of denoising predictions.
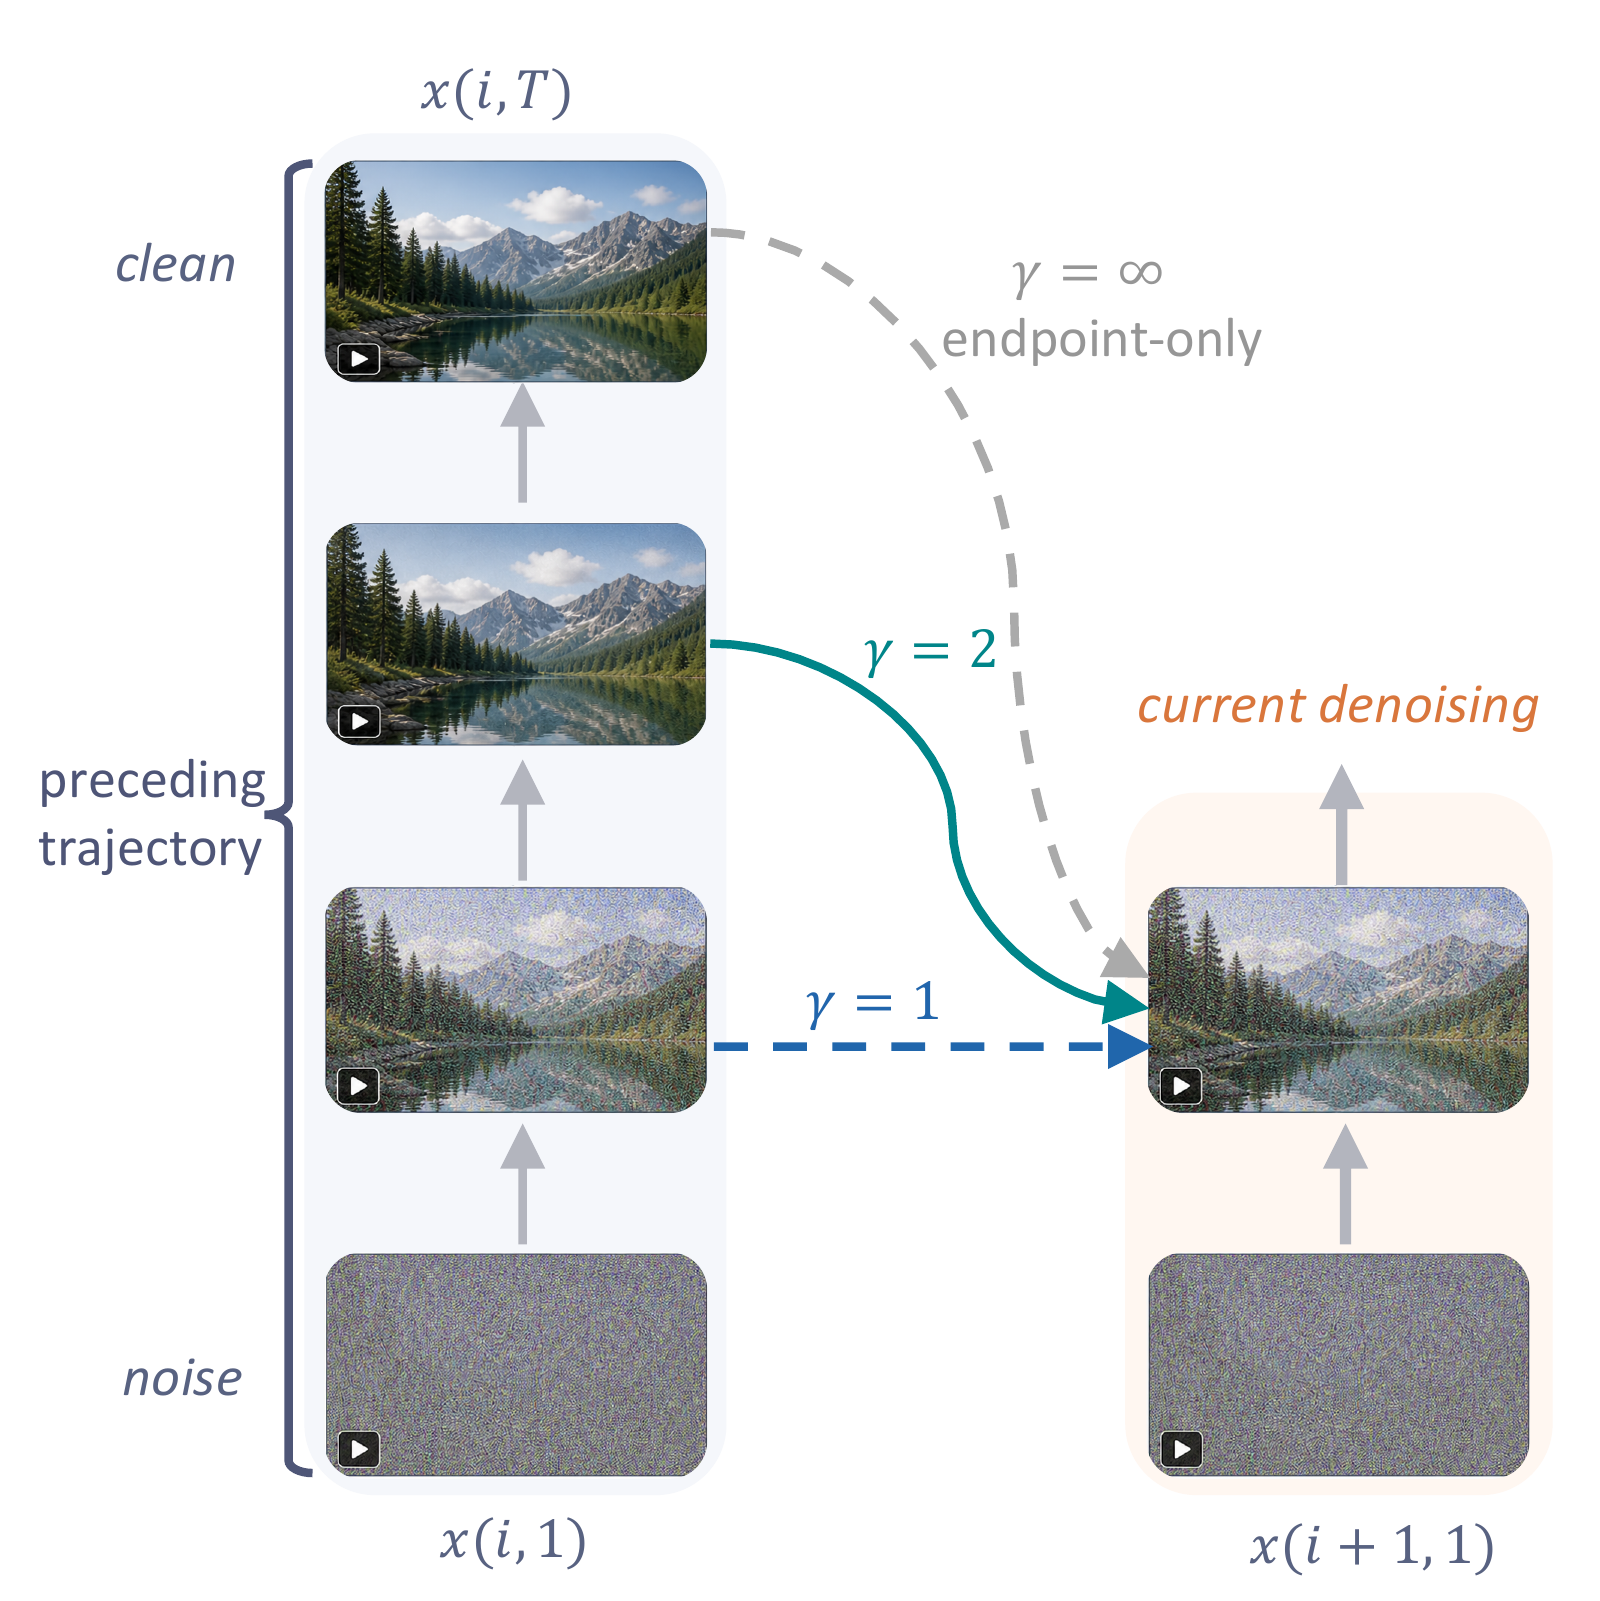
Conceptual view Endpoint-only conditioning uses each earlier chunk’s final output; trajectory conditioning also draws on intermediate predictions.
Each column is one chunk’s denoising trajectory, from Gaussian noise at the top to its final output at the bottom.
In this conceptual view, the shaded history includes complete earlier trajectories and the current chunk’s earlier states. The arrow shows how this history conditions the current update. The current chunk’s initial noise is sampled without conditioning.
In practice, each update uses one selected clean-signal prediction from each retained preceding chunk. Selection details.
02METHOD
From trajectory learning to practical conditioning
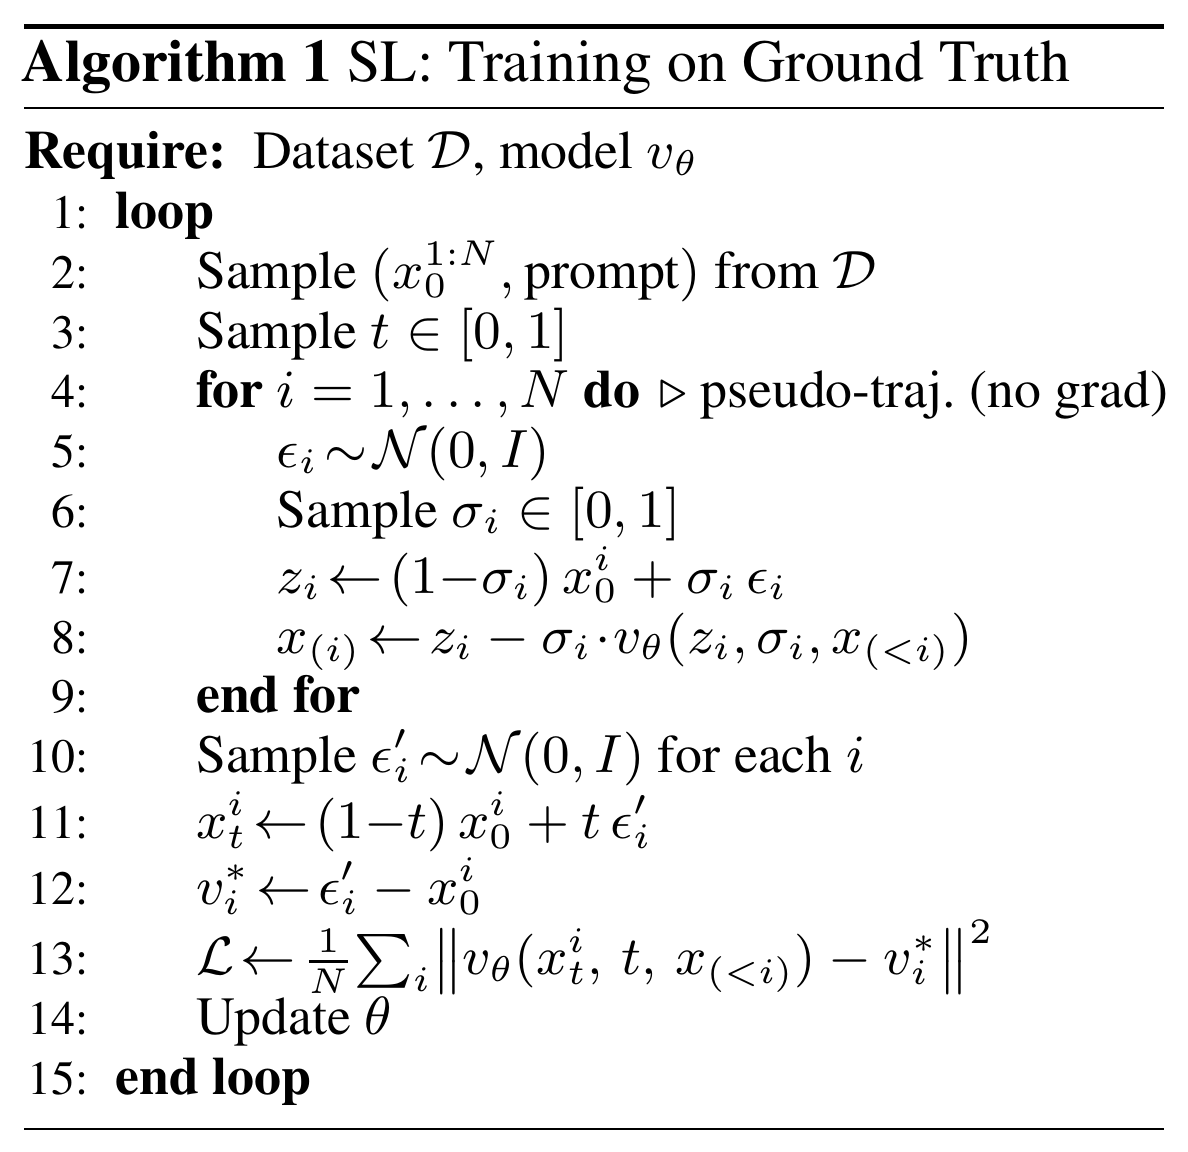
Ground-truth videos have no model-generated denoising history, so TraF learns in two stages: pseudo-trajectories first, then trajectories from its own rollouts.
Stage 1 · SL
Pseudo-trajectories from ground truth
Source
Ground-truth videos
Context
At a sampled noise level, one velocity prediction per chunk gives a clean-signal estimate. Sampling different noise levels across training yields the pseudo-trajectory points.
Objective
Flow matching
Algorithm 1 pseudo-code from the paper
initializes
Stage 2 · RL
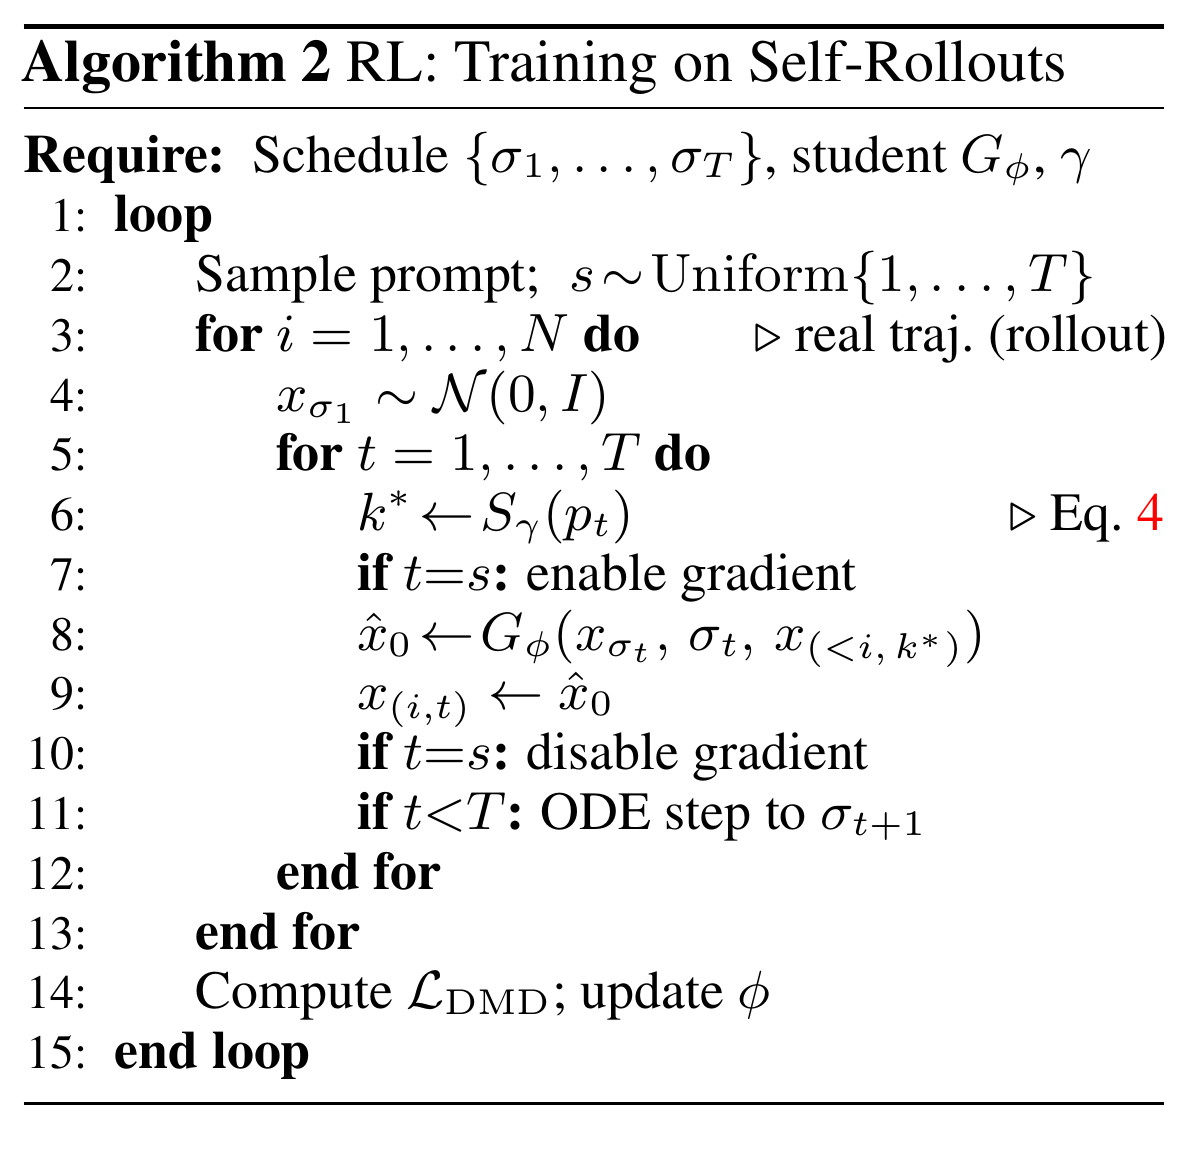
Real trajectories from self-rollout
Source
Initialized from the SL model, the student generates chunks autoregressively with a four-step self-rollout
Context
Its four denoising predictions form each chunk’s real trajectory; selected predictions condition later chunks
Objective
Distribution Matching Distillation (DMD) with a frozen teacher and a learned critic
Algorithm 2 pseudo-code from the paper
Selection · practical conditioning
Using trajectory context efficiently
Full-trajectory conditioning adds attention and memory cost. TraF uses one selected prediction per retained preceding chunk at each update.
A preceding chunk’s trajectory supplies context to the current update. Arrows are illustrative, not a timestep mapping.
Cache
Clean-signal predictions from preceding chunks, not noisy latents.
Context
One selected prediction from each retained preceding chunk at each denoising update.
Rule
On the finite denoising grid, select the available prediction nearest to the regularized target progress.
Selection rule continuous target & discrete steps
The continuous target scales the current step’s amplitude signal-to-noise ratio by γ.
Sγ(p) = γp1 + (γ − 1)p
p = 1 − σ is denoising progress, from noise (0) to clean signal (1); γ ≥ 1.
On the finite grid, TraF adds a regularization term to the target ratio and converts it to progress before selecting the nearest available prediction. See Appendix A of the paper.
We first examine 30-second generation, then generation at TraF’s five-second training duration. These comparisons from the paper span different model and training configurations.
Two evaluation settings. Different prompt sets and scoring protocols: the 5-second and 30-second scores are not directly comparable.
30-second generation
6× TraF’s training duration
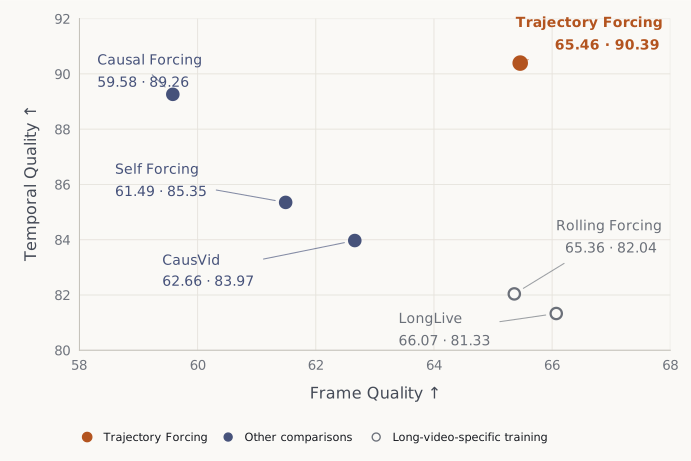
We evaluated each method on the same 128 MovieGenBench prompts. Nine VBench dimensions are grouped into Temporal Quality, Frame Quality and Text Alignment; Total is the equal-weighted average of these three axes.
30-second evaluation. Frame Quality and Temporal Quality are higher-is-better. Labels show Frame / Temporal scores. Axes are zoomed; hollow markers denote long-video-specific training.
30-second VBench axes, total score, VideoScore2 and Quality Drift for six selected methods, with long-video-specific training shown as a separate group.
Method
Total ↑
Temporal Quality ↑
Frame Quality ↑
Text Alignment ↑
VideoScore2 ↑
Quality Drift ↓
Main comparisons
CausVid1.3B · Wan-14B teacher
68.50
83.97
62.66
58.88
3.549
2.72
Causal Forcing1.3B · Wan-14B teacher
70.48
89.26
59.58
62.61
3.589
4.36
Self Forcing1.3B · Wan-14B teacher
71.06
85.35
61.49
66.33
3.719
2.21
Trajectory Forcing Ours1.3B · Wan-14B teacher
73.98
90.39
65.46
66.08
3.771
1.38
Long-video-specific training
Rolling Forcing1.3B · Wan-14B teacher
71.39
82.04
65.36
66.77
3.804
0.56
LongLive1.3B · Wan-14B teacher
71.48
81.33
66.07
67.04
3.801
0.60
Rolling Forcing and LongLive use long-video-specific training and their own inference architectures. SF, CF and TraF use the same sliding-window inference with an attention sink in this evaluation.
TraF’s 30-second Total is 2.92 points higher than Self Forcing (95% paired prompt-bootstrap CI: +2.06 to +3.78).
Quality Drift is the absolute imaging-quality difference between the first and last 5-second segments; lower is better. VideoScore2 reports its text-alignment sub-score. All other columns are higher-is-better.
Bold marks the best value in each column across all displayed methods. TraF leads Total and Temporal Quality; LongLive leads Frame Quality and Text Alignment; Rolling Forcing leads VideoScore2 and has the lowest Quality Drift. See the paper for all methods.
5-second generation
VBench · short video
946 prompts, all 16 VBench dimensions. Total = (4 × Quality + Semantic) / 5. Throughput and latency are reported in FPS and seconds, respectively.
5-second VBench scores and inference speed for twelve selected methods across three model categories.
Method
Total ↑
Quality ↑
Semantic ↑
Throughput ↑FPS
Latency ↓seconds
Bidirectional Video Diffusion
LTX-Video1.9B · Teacher —
79.83
81.88
71.62
8.98
13.5
Wan2.1-1.3B1.3B · Teacher —
83.37
84.30
79.65
0.78
103
Autoregressive Video Diffusion
MAGI-14.5B · Teacher —
78.88
81.67
67.72
0.19
282
NOVA0.6B · Teacher —
80.31
80.66
78.92
0.88
4.1
Pyramid Flow2B · Teacher —
80.75
83.41
70.11
6.70
2.5
SkyReels-V21.3B · Teacher —
81.97
83.96
74.01
0.49
112
Distilled Autoregressive Video Diffusion
CausVid1.3B · Wan-14B teacher
81.33
83.98
70.72
17.0
0.69
Rolling Forcing1.3B · Wan-14B teacher
83.07
83.61
80.89
15.8
0.76
LongLive1.3B · Wan-14B teacher
83.09
83.69
80.69
18.0
0.65
Causal Forcing1.3B · Wan-14B teacher
84.04
84.59
81.84
17.0
0.69
Self Forcing1.3B · Wan-14B teacher
84.31
85.07
81.28
17.0
0.69
Trajectory Forcing Ours1.3B · Wan-14B teacher
85.15
85.89
82.20
15.0
0.78
We evaluated TraF, Rolling Forcing and LongLive. The Self Forcing row comes from its original paper. The other rows shown here come from the Causal Forcing paper. See the full table and sources in the paper.
Bold marks the best reported value in each column. Among the methods shown, TraF leads on Total, Quality and Semantic. LongLive has the highest reported throughput and lowest reported latency.
SF / CF / TraF setup
Base model
Wan2.1-T2V-1.3B
Inference
4 steps
Resolution
832×480
Video frame rate
16 fps
Self Forcing, Causal Forcing and Trajectory Forcing use the same backbone architecture and teacher during RL. TraF starts from its SL checkpoint, while SF and CF use their original initializations. In the 30-second evaluation, all three use the same sliding-window inference with an attention sink.
The following three ablations examine the information in trajectory context, learning before distillation, and the choice of conditioning predictions.
Evidence · 5-second VBench
Testing the information in trajectory context
Adding Gaussian noise to endpoint predictions lowers Total at both tested magnitudes. The unperturbed endpoint scores 84.24.
VBench Total ↑ higher is better
Gaussian σ = 0.22
83.87
Gaussian σ = 0.11
83.95
Trajectory predictions
85.15
View all three VBench metrics
5-second VBench ablation. Endpoint predictions with added isotropic Gaussian noise serve as the context for the two noise controls. All three metrics are higher-is-better.
5-second VBench noise versus trajectory ablation.
Context
Total ↑
Quality ↑
Semantic ↑
Noisy endpoint, σ = 0.22
83.87
84.76
80.29
Noisy endpoint, σ = 0.11
83.95
84.92
80.08
Trajectory
85.15
85.89
82.20
Training evidence
SL stage, before distillation
Same architecture and data, evaluated before distillation with 50-step denoising on 5-second VBench. All three metrics are higher-is-better.
SL-stage ablation before distillation, evaluated with 50-step denoising.
SL strategy
Total ↑
Quality ↑
Semantic ↑
Teacher Forcing
83.47
84.09
81.02
Diffusion Forcing
84.07
84.66
81.68
Trajectory
84.39
85.25
80.96
Trajectory has the highest Total and Quality; Diffusion Forcing has the highest Semantic score. These SL-stage scores use a different evaluation stage and denoising schedule from the final four-step model.
Conditioning evidence
Choosing trajectory context
5-second VBench full-pipeline ablation. Each γ setting uses a separately trained and evaluated model. See Figure 2 of the paper. All three metrics are higher-is-better.
5-second VBench full-pipeline selection ablation from Figure 2.
γ
Total ↑
Quality ↑
Semantic ↑
1
84.82
85.49
82.10
2
85.15
85.89
82.20
3
85.13
85.91
81.97
5
84.58
85.47
81.03
10
84.62
85.40
81.50
∞
84.24
85.04
81.07
Every finite γ reported here has a higher Total than endpoint-only conditioning (γ → ∞). γ = 2 and 3 give the highest Total scores. Bold marks the best value in each column.
04Videos
30-second comparisons
Selected qualitative examples from SF, CF and TraF, played together at the original speed.
Prompt
The comparison plays the first 30 seconds of each video at original speed. “Full video” opens the complete file. Comparisons with other methods are in the paper.
@inproceedings{wang2026trajectoryforcing,
  title     = {Trajectory Forcing: Exploiting Diffusion Trajectories for
               Autoregressive Long Video Generation},
  author    = {Wang, Bohan and Chen, Shuo and Li, Yunzhi and
               Chen, Zhaozheng and Zhang, Junzhe and Zhang, Hanwang},
  booktitle = {Advances in Neural Information Processing Systems},
  year      = {2026}
}